
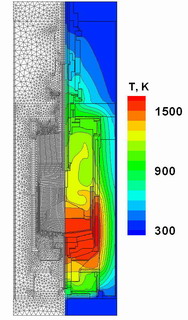
 Fig. 1.
The computational grid and the temperature distribution in the VCz
system for 4" GaAs crystal growth
|
Modeling of the VCz GaAs growth
Numerical investigation of the effect of radiative heat exchange
in the encapsulant was performed using CGSim software with respect to
its influence on the crystallization front geometry during
encapsulated GaAs Czochralski growth with the vapor pressure control
[1]. Radiative heat exchange, conductive heat exchange and turbulent
flows within the Reynolds-averaged Navier-Stokes (RANS) equations are
considered in a conjugated way. Advanced analysis of heat transfer
and melt/encapsulant flows in the crystallization zone is performed
within updated 3D unsteady approach based on the LES technique. The
3D analysis is applied to describe the real melt flow behavior, which
is not always possible within the RANS approach usually resulting in
steady state axisymmetric flow patterns. It should be mentioned that
the 3D flows of the melt and encapsulant were considered in a way
with conjugated heat and momentum exchange.
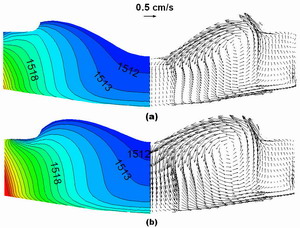 Fig. 2.
The temperature distributions and the flow patterns obtained in the 2D
computations (VCz system for 4" GaAs crystal growth). The encapsulant
is considered as an opaque (a) or a transparent (b) medium.
|
The effect of optical properties of the encapsulant layer is additionally considered in two opposite cases to reveal their contribution to the crystallization front formation. It is evident that optical properties of the encapsulant affect both the temperature distribution and melt velocity. In the case of transparent encapsulant, the temperature difference in the melt is higher due to the intensified heat transport through the melt-encapsulant interface. For the case of opaque encapsulant, a lower temperature difference in the melt is sufficient to maintain the desired crystallization rate.
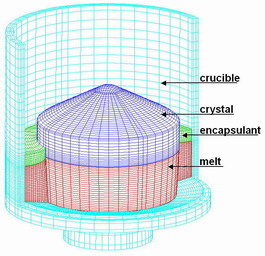 Fig. 3.
An example of the 3D block-structured computational grid for
crystallization zone.
|
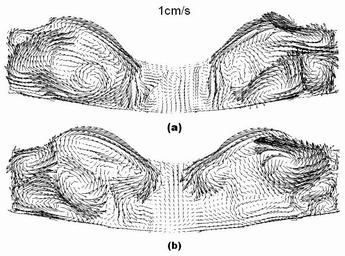 Fig. 4.
The instantaneous flow patterns obtained in the 3D computations
(VCz system for 4" GaAs crystal growth). The encapsulant is
considered as an opaque (a) or a transparent medium (b).
|
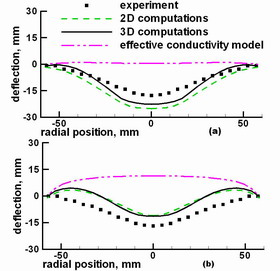 Fig. 5.
The comparison of the computed and experimental crystallization
front shape (VCz system for 4" GaAs crystal growth). The encapsulant
is considered as an opaque (a) or a transparent medium (b).
|
Of high interest is the fact that there are significant differences between the results of the flow prediction using the steady 2D and unsteady 3D approaches. The 2D RANS approach predicts that the melt flow is practically suppressed in the melt periphery under the encapsulant layer, which is not proved, analyzing the data provided by more general 3D computations. Using both approaches, the melt flow under the crystal is described in a similar manner; however, there is a certain difference near the axis of symmetry. 3D unsteady modeling revealed small turbulent structures near the axis; whereas there is only downward melt motion in the data of RANS analysis. The effect of optical properties of the encapsulant, obtained in 3D analysis, has showed that the increase in temperature difference in the melt for the case of transparent encapsulant layer results in intensifying melt fluctuating velocity, especially, under the encapsulant.
One can see that the optical properties of the encapsulant
noticeably affect the crystallization front shape formation. Note
that both 2D and 3D flow models predict overestimated interface
deflection for the case of opaque encapsulant and underestimated
deflection for the case of transparent encapsulant, in such a way
that the adequate result should be obtained by means of a relevant
semitransparent optical model.
References
[1] O.V. Smirnova, V.V. Kalaev, Yu.N. Makarov, Ch. Frank-Rotsch,
M. Neubert, P. Rudolph, J. of Crystal Growth 266(2004) 67-73